266 buyer contacts in 12 months from a new page.
From November 2025 to October 2026, the first 12 complete months after Zero Dimensions put a dedicated tarpaulin landing page for H.N. Industries live, it brought 47 enquiry forms (43 recorded by Google Analytics and about 4 estimated for August 2026, when the thank-you page did not record them) and 217 WhatsApp chat-button clicks. The estimated Google Ads cost per enquiry form fell from ₹1,349 in the first six months to ₹627 in the last six (source: Google Analytics and Google Ads). Call-button taps on H.N. Industries' Google Business Profile rose from 16 in June–October 2025 to 54 in June–October 2026 (source: Google Business Profile).
- Client
- H.N. Industries
- Industry
- Manufacturing
- Services
- Performance marketing, SEO, Local SEO
- Result
- 266 buyer contacts in 12 months from a new page: 217 WhatsApp clicks, 47 enquiry forms (about 4 estimated for Aug 2026) and 2 calls; cost per enquiry ₹1,349 → ₹627; position 2 for 'top 10 tarpaulin manufacturers in india'
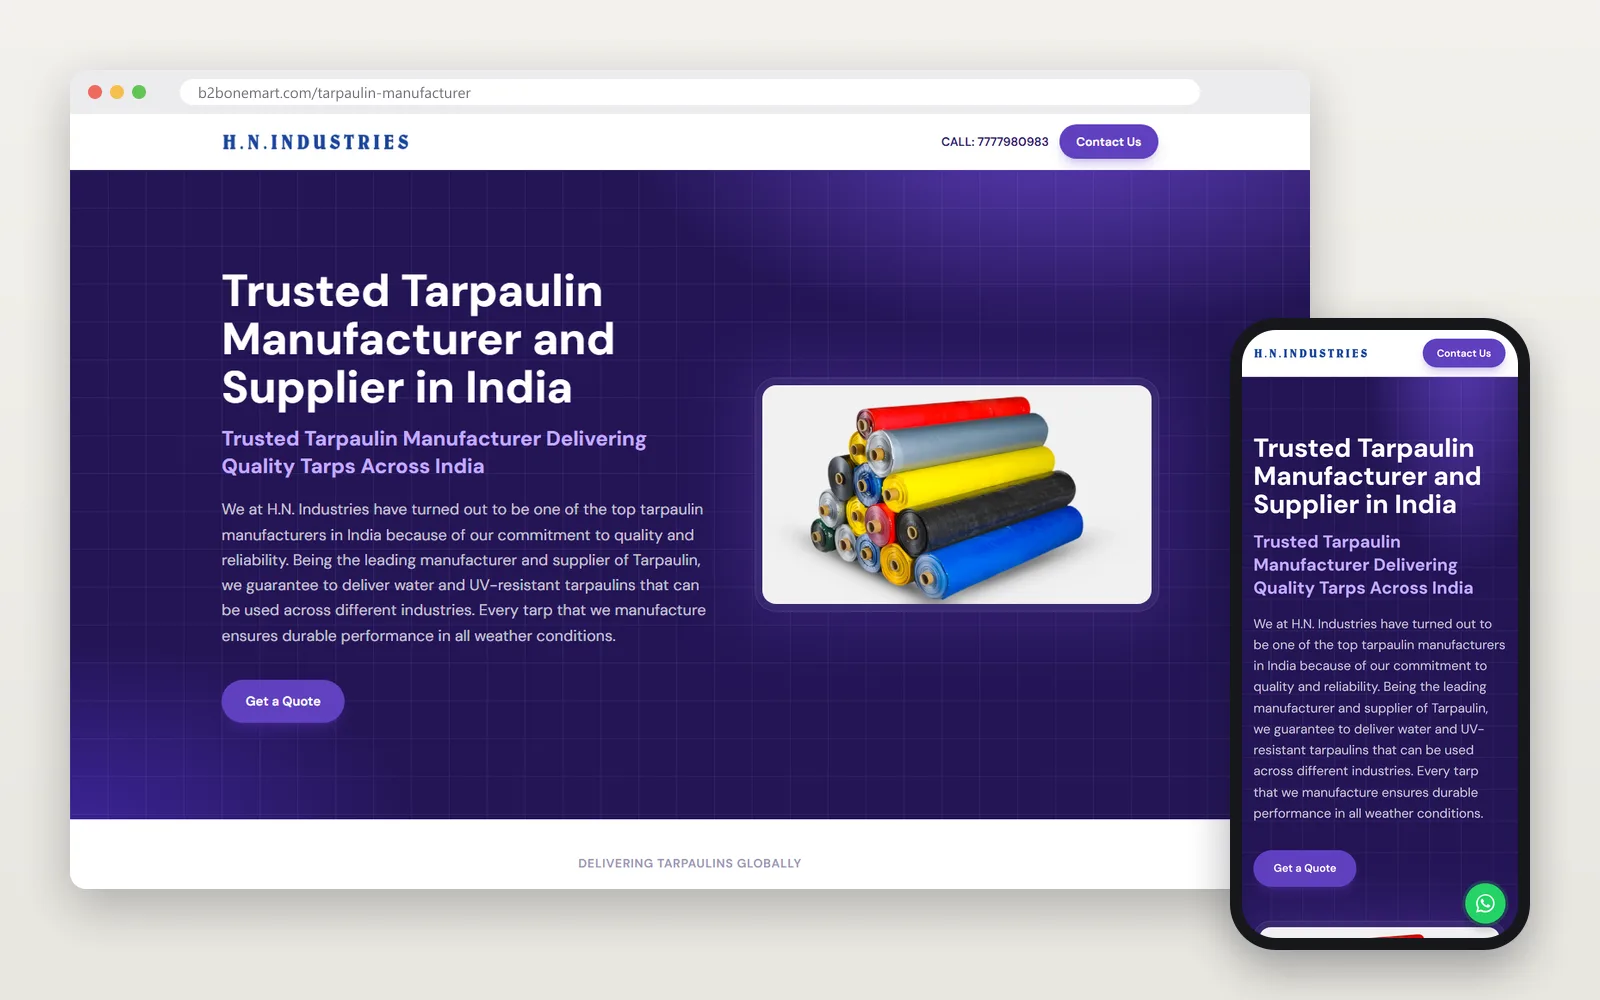
From November 2025 to October 2026, the first 12 complete months after Zero Dimensions put a dedicated tarpaulin landing page for H.N. Industries live, it brought 47 enquiry forms (43 recorded by Google Analytics and about 4 estimated for August 2026, when the thank-you page did not record them) and 217 WhatsApp chat-button clicks, and the estimated Google Ads cost per enquiry form fell from ₹1,349 in the first six months to ₹627 in the last six (source: Google Analytics and Google Ads). Call-button taps on H.N. Industries' Google Business Profile rose from 16 in June–October 2025 to 54 in June–October 2026 (source: Google Business Profile).
The challenge
H.N. Industries makes tarpaulins in Ahmedabad: HDPE tarpaulins and sheets, LD panni, canvas, truck and wagon covers, agricultural covers, pond liners and custom sizes. It wanted enquiries from business buyers across India: transporters, farmers and agri-businesses, contractors and warehouses.
Before October 2025 there was no landing page to send buyers to, so the starting point was zero: no page, no visits and no enquiries. Its Google Business Profile had been running for months, with about 120 views and 4 call clicks a month from May to October 2025 (Business Profile, as reported by Google), but no website for buyers to land on.
Tarpaulin is a crowded search. Buyers type short words like "tarpaulin" or the Hindi and regional names for it, and many of them want one sheet for home use, not a bulk order. Other manufacturers and the large B2B marketplaces compete for the same searches.
What we did
Built a dedicated tarpaulin landing page for H.N. Industries
The page went live on 29 October 2025. It shows H.N. Industries' name, address and 14 product types, its manufacturing process, the industries it supplies and answers to common buyer questions. Buyers can send an enquiry form, which takes them to a thank-you page for H.N. Industries, tap a WhatsApp button that opens a chat with the company, or call.
Added an HDPE tarpaulin page
A second page for HDPE tarpaulins and sheets, the product H.N. Industries makes most of, was published on 13 December 2025 as a sub-page of the landing page, with its own product list, uses by industry and enquiry buttons.
Ran a Google Ads Search campaign to the page
We started a Search campaign on 26 November 2025, showing ads across India to people searching for tarpaulins and tarpaulin manufacturers and suppliers, and sending every click to the tarpaulin page. In July 2026 we added three ad groups for city searches, product searches (HDPE, PVC, truck covers) and wholesale buyers, and from August 2026 we ran the campaign on a smaller budget. In all, the campaign spent ₹36,601 on 2,475 clicks up to 5 November 2026 (Google Ads).
Managed the Google Business Profile
We manage H.N. Industries' Google Business Profile, the listing buyers see on Google Search and Maps. We pointed its website link at the new landing page, so buyers who find the listing can see the full product range and send an enquiry; the first website click from the profile came on 3 November 2025.
Counted every enquiry in Google Analytics
Every enquiry form on the page leads to a thank-you page for H.N. Industries, and Google Analytics also records clicks on the WhatsApp, call and enquiry-form buttons. That let us count enquiries by source, Google Ads or organic search, and work out what each enquiry cost.
Results
In the 12 complete months after launch, November 2025 to October 2026, H.N. Industries' two pages were viewed 2,459 times: 1,907 times from Google Ads and 312 from organic search (Google Analytics). Google Analytics recorded 43 enquiry-form submissions: 37 from Google Ads visits, 4 from organic search and 2 from other visits. With about 4 more estimated for August 2026, when the thank-you page did not record them, the total is 47, 41 of them from Google Ads visits. The first came on 24 December 2025, 56 days after the page went live and 28 days after the first ad click.
The campaign spent ₹36,542 in those months, an estimated ₹891 for each enquiry form sent from a Google Ads visit, including the August 2026 estimate. The cost fell from ₹1,349 in the first six months (₹20,242 for 15) to ₹627 in the last six (₹16,300 for 26, including about 4 estimated for August 2026). September and October 2026 brought 13 enquiry forms from ₹3,063 of spend, about ₹236 each.
| Month | From Google Ads visits | From organic search | From other visits | Total | Google Ads spend | Estimated cost per Google Ads enquiry |
|---|---|---|---|---|---|---|
| November 2025 | 0 | 0 | 0 | 0 | ₹1,183 | – |
| December 2025 | 2 | 0 | 0 | 2 | ₹5,311 | ₹2,656 |
| January 2026 | 8 | 1 | 0 | 9 | ₹4,994 | ₹624 |
| February 2026 | 2 | 0 | 1 | 3 | ₹3,457 | ₹1,729 |
| March 2026 | 1 | 0 | 0 | 1 | ₹2,785 | ₹2,785 |
| April 2026 | 2 | 0 | 1 | 3 | ₹2,512 | ₹1,256 |
| May 2026 | 2 | 0 | 0 | 2 | ₹5,075 | ₹2,537 |
| June 2026 | 5 | 1 | 0 | 6 | ₹3,680 | ₹736 |
| July 2026 | 2 | 1 | 0 | 3 | ₹3,603 | ₹1,801 |
| August 2026 | ≈4 (estimated) | 0 | 0 | ≈4 (estimated) | ₹879 | ≈₹220 (estimated) |
| September 2026 | 7 | 0 | 0 | 7 | ₹2,245 | ₹321 |
| October 2026 | 6 | 1 | 0 | 7 | ₹818 | ₹136 |
| November 2025–April 2026 | 15 | 1 | 2 | 18 | ₹20,242 | ₹1,349 |
| May–October 2026 (August estimated) | 26 | 3 | 0 | 29 | ₹16,300 | ₹627 |
| November 2025–October 2026 (August estimated) | 41 | 4 | 2 | 47 | ₹36,542 | ₹891 |
August 2026 is an estimate: the thank-you page recorded almost nothing from 3 to 31 August, so August's 5 enquiry-form starts were multiplied by the share of form starts that ended in an enquiry form in the other months (43 of 61, 71%) and the result, about 4, is counted as Google Ads enquiries.
Sources: Google Analytics, views of the H.N. Industries enquiry form's thank-you page by month, landing page and session default channel group ("Google Ads visits" = Paid Search), pulled on 9 November 2026. Left out: 5 views in visits that started on the thank-you page itself (bookmarks or direct visits, not form submissions) and 2 direct visits on 1 September 2026, the day the new Google Ads thank-you tag was being tested. Repeat views in one visit are counted, so the 37 recorded Google Ads enquiries came from 32 separate visits (about ₹1,142 each, with no August enquiries counted). Spend from Google Ads, campaign report, checked on 9 November 2026. Estimated cost per enquiry = Google Ads spend ÷ thank-you page views from Google Ads visits in the same months, with August 2026's estimate counted as Google Ads. Google Ads itself reported 0 conversions for this campaign. These are forms recorded on the page (estimated for August 2026), not orders.
The numbers behind this chart
| Month | Google Ads visits | Organic search | Other visits |
|---|---|---|---|
| Nov 2025 | 0 | 0 | 0 |
| Dec 2025 | 2 | 0 | 0 |
| Jan 2026 | 8 | 1 | 0 |
| Feb 2026 | 2 | 0 | 1 |
| Mar 2026 | 1 | 0 | 0 |
| Apr 2026 | 2 | 0 | 1 |
| May 2026 | 2 | 0 | 0 |
| Jun 2026 | 5 | 1 | 0 |
| Jul 2026 | 2 | 1 | 0 |
| Aug 2026 | 0 | 0 | 0 |
| Sep 2026 | 7 | 0 | 0 |
| Oct 2026 | 6 | 1 | 0 |
The numbers behind this chart
| Month | Google Ads spend |
|---|---|
| Nov 2025 | ₹1,183 |
| Dec 2025 | ₹5,311 |
| Jan 2026 | ₹4,994 |
| Feb 2026 | ₹3,457 |
| Mar 2026 | ₹2,785 |
| Apr 2026 | ₹2,512 |
| May 2026 | ₹5,075 |
| Jun 2026 | ₹3,680 |
| Jul 2026 | ₹3,603 |
| Aug 2026 | ₹879 |
| Sep 2026 | ₹2,245 |
| Oct 2026 | ₹818 |
Buyers also used the page's quicker contact buttons. From December 2025, when button tracking started, to October 2026, Google Analytics recorded 217 clicks on the WhatsApp chat button, 196 of them from Google Ads visits, and 66 starts of the enquiry form. July 2026 alone brought 47 WhatsApp clicks. Google Ads separately reported 16 calls from the ads' call button between May and August 2026 (as reported by Google).
| Month | WhatsApp chat-button clicks (Google Analytics) | Enquiry forms started (Google Analytics) | Enquiry forms sent (Google Analytics thank-you views) | Call-button clicks (Google Analytics) | Calls from ads (as reported by Google) |
|---|---|---|---|---|---|
| December 2025 | 15 | 6 | 2 | – | 0 |
| January 2026 | 31 | 10 | 9 | – | 0 |
| February 2026 | 13 | 4 | 3 | – | 0 |
| March 2026 | 11 | 4 | 1 | – | 0 |
| April 2026 | 11 | 3 | 3 | – | 0 |
| May 2026 | 20 | 4 | 2 | – | 10 |
| June 2026 | 21 | 7 | 6 | – | 5 |
| July 2026 | 47 | 5 | 3 | – | 0 |
| August 2026 | 10 | 5 | ≈4 (estimated) | – | 1 |
| September 2026 | 31 | 10 | 7 | 1 | 0 |
| October 2026 | 7 | 8 | 7 | 1 | 0 |
| December 2025–October 2026 (August enquiry forms estimated) | 217 | 66 | 47 | 2 | 16 |
August 2026's enquiry forms sent are estimated, because the thank-you page did not record them from 3 to 31 August: 5 form starts × 71%, the share of form starts that ended in an enquiry form in the other months (43 of 61).
Sources: Google Analytics, events on the landing page and its HDPE sub-page by month, pulled on 9 November 2026. WhatsApp clicks are the "click to chat" event to July 2026, clicks on the WhatsApp link in August 2026 (when no chat event was recorded) and the "click_to_chat" event from September 2026; 196 of the 217 came from Google Ads visits and 14 from organic search. Clicks on the page's own call button have been tracked only since 11 September 2026 ("–" = not tracked). Calls from ads: Google Ads, campaign report, phone calls, as reported by Google, not added to the Google Analytics counts. Clicks are not conversations or answered calls.
Organic search added a steady second flow. The two pages first appeared in Google in late October 2025 and from October 2025 to October 2026 got 189 clicks from 13,391 appearances in Google's results (Search Console). Organic clicks reached 97 from March to July 2026, and four of the 47 enquiry forms (43 recorded and about 4 estimated for August 2026) came from organic visits.
| Month | Clicks | Impressions | Average position | Enquiry forms from organic visits (Google Analytics) |
|---|---|---|---|---|
| October 2025 (from 29 October) | 1 | 14 | 26.4 | 0 |
| November 2025 | 18 | 288 | 9.7 | 0 |
| December 2025 | 26 | 663 | 16.1 | 0 |
| January 2026 | 13 | 894 | 18.8 | 1 |
| February 2026 | 11 | 1,088 | 15.4 | 0 |
| March 2026 | 19 | 1,705 | 9.4 | 0 |
| April 2026 | 10 | 1,720 | 11.9 | 0 |
| May 2026 | 24 | 1,832 | 13.8 | 0 |
| June 2026 | 21 | 1,987 | 12.6 | 1 |
| July 2026 | 23 | 1,245 | 13.4 | 1 |
| August 2026 | 6 | 643 | 15.2 | 0 |
| September 2026 | 11 | 720 | 13.8 | 0 |
| October 2026 | 6 | 592 | 13.8 | 1 |
| October 2025–October 2026 | 189 | 13,391 | 13.3 | 4 |
Source: Google Search Console, web search, the landing page and its HDPE sub-page by month, pulled on 9–10 November 2026. Average position is weighted by impressions. Enquiry forms from organic visits: Google Analytics thank-you page views in Organic Search visits, counted as in the first table; August 2026's estimated enquiry forms are counted as Google Ads, so none is added here. Organic search only; Google Ads clicks are not included.
The page now shows up for the searches bulk buyers use. Over the 13 months it averaged position 2.0 for "top 10 tarpaulin manufacturers in india", 9.9 for "industrial tarpaulin" and 15.2 for "export quality tarpaulin manufacturer". Searches for H.N. Industries by name brought 15 clicks at an average position of 5.4.
| Search | Impressions | Clicks | Average position |
|---|---|---|---|
| top 10 tarpaulin manufacturers in india | 229 | 0 | 2.0 |
| industrial tarpaulin | 332 | 0 | 9.9 |
| waterproof tarpaulin manufacturers | 20 | 0 | 13.3 |
| export quality tarpaulin manufacturer | 264 | 0 | 15.2 |
| tarpaulin bulk order | 20 | 0 | 16.1 |
| tarpaulin manufacturer in india | 108 | 1 | 23.0 |
| hdpe tarpaulin manufacturer in india | 74 | 0 | 24.0 |
| tarpaulin manufacturer | 434 | 11 | 24.6 |
| hn industries / h n industries (the client's name) | 161 | 15 | 5.4 |
Source: Google Search Console, web search, searches that showed the landing page or its HDPE sub-page, 1 October 2025 to 31 October 2026, pulled on 10 November 2026. Average position is weighted by impressions. Google hides rare searches, so these searches account for only part of the 189 clicks. The client's-name row combines two spellings (98 and 63 impressions).
The numbers behind this chart
| Month | Organic Google clicks |
|---|---|
| Oct 2025 | 1 |
| Nov 2025 | 18 |
| Dec 2025 | 26 |
| Jan 2026 | 13 |
| Feb 2026 | 11 |
| Mar 2026 | 19 |
| Apr 2026 | 10 |
| May 2026 | 24 |
| Jun 2026 | 21 |
| Jul 2026 | 23 |
| Aug 2026 | 6 |
| Sep 2026 | 11 |
| Oct 2026 | 6 |
More buyers also contacted H.N. Industries straight from its Google Business Profile. From June to October 2026, buyers tapped the profile's call button 54 times, against 16 in the same months of 2025, asked for directions to the factory 294 times, against 215, and clicked through to the landing page 46 times, against none. Profile views rose from 622 to 1,664. Over the 12 months from November 2025 to October 2026, the profile brought 105 call-button taps, 672 direction requests and 119 website clicks (Google Business Profile).
| Month | Call-button taps | Direction requests | Website clicks | Profile views |
|---|---|---|---|---|
| June 2025 | 1 | 40 | 0 | 122 |
| July 2025 | 4 | 31 | 0 | 135 |
| August 2025 | 5 | 47 | 0 | 125 |
| September 2025 | 2 | 51 | 0 | 116 |
| October 2025 | 4 | 46 | 0 | 124 |
| November 2025 | 5 | 37 | 16 | 223 |
| December 2025 | 5 | 74 | 15 | 297 |
| January 2026 | 4 | 69 | 9 | 242 |
| February 2026 | 7 | 37 | 10 | 247 |
| March 2026 | 7 | 34 | 11 | 221 |
| April 2026 | 2 | 42 | 4 | 245 |
| May 2026 | 21 | 85 | 8 | 370 |
| June 2026 | 14 | 50 | 14 | 373 |
| July 2026 | 20 | 88 | 22 | 456 |
| August 2026 | 8 | 59 | 1 | 272 |
| September 2026 | 5 | 51 | 6 | 240 |
| October 2026 | 7 | 46 | 3 | 323 |
| June–October 2025 | 16 | 215 | 0 | 622 |
| June–October 2026 | 54 | 294 | 46 | 1,664 |
| November 2025–October 2026 | 105 | 672 | 119 | 3,509 |
Source: Google Business Profile, daily performance figures for H.N. Industries' profile added up by month, pulled on 10 November 2026 (as reported by Google). Call-button taps are taps on the profile's call button, not answered calls. Profile views are the daily counts of people who saw the profile on Google Search and Maps, added up, so they can differ slightly from the Business Profile dashboard. Google keeps about 18 months of profile data, which starts on about 10 May 2025, so the year-on-year comparison uses June to October. Website clicks lead to the landing page, so some of them are among the page visits counted above. Calls from the ads' call button are reported separately by Google Ads and are not in these figures.
The numbers behind this chart
| Measure | June–October 2025 | June–October 2026 | Change |
|---|---|---|---|
| Call-button taps | 16 | 54 | +238% |
| Direction requests | 215 | 294 | +37% |
| Website clicks | 0 | 46 | – |
What else changed, and what didn't work
What else changed
- This is a new page, not a before-and-after. The page did not exist before 29 October 2025, so the baseline is zero. We compare the first and last six of its first 12 complete months; tarpaulin demand also rises before and during the monsoon. Monthly counts are small, so one or two enquiries change a month's cost a lot.
- The campaign changed in July 2026. Three new ad groups were added and the ads also started showing on Google's search partner sites. July brought 340 clicks, the most of any month, but only 2 enquiry forms; spend was then lowered from August. The cheaper enquiries of September and October 2026 came on a smaller budget.
- The Business Profile grew while the ads ran. The Google Ads campaign ran in the same months as the profile's rise, so the profile's growth is not from the profile work alone. Call-button taps were highest in May–July 2026, while the campaign spent ₹3,603–₹5,075 a month, and fell back to 5–8 a month from August, when the budget was lowered.
- Other channels and tracking. H.N. Industries may also get enquiries from its own channels, B2B marketplaces or repeat buyers; this case study counts only what happened on the landing page and sub-page we built. The WhatsApp event was renamed in August–September 2026 and the call-button event added on 11 September 2026. Three form submissions from the tarpaulin page on 14–17 December 2025 were recorded on another client's thank-you page and are not counted here.
- August 2026 is estimated. August's enquiry forms are estimated from form starts, because the thank-you page did not record them from 3 to 31 August.
What didn't work
- Google Ads couldn't see the enquiries. The campaign was set to get as many conversions as possible, but no H.N. Industries enquiry counted as a conversion, so Google reported 0 conversions on ₹36,601 of spend and had nothing to optimise for. A conversion action for the thank-you page was added on 4 September 2026 and recorded 12 enquiries to 4 November 2026, matching Google Analytics, but it was set as a secondary action, so it still doesn't count in "Conversions".
- Many searches were not bulk buyers. The broad keyword "tarpaulin" took ₹9,629 of the spend. Search terms included Hindi and Tamil words for tarpaulin with "price" or "shop near me", other manufacturers' names and B2B marketplace names.
- Some months were weak. March 2026 recorded one enquiry form, at ₹2,785. Organic clicks fell from 23 in July 2026 to 6 in August and October 2026, in step with a wider fall in organic search across the website that hosts the pages.
- No catalogue. The page has no catalogue to download, so buyers who want specifications and sizes before they enquire have to ask.
Figures checked on 10 November 2026. Enquiry counts are enquiry forms recorded by Google Analytics on the landing page we built for the client, except August 2026, which is estimated from form starts; they are not orders. Google Ads and Business Profile figures are as reported by Google.
More work
- Performance marketing
Arsaa Jewels
75 buyer actions in 7 weeks
75 buyer actions in 7 weeks: 57 WhatsApp clicks and 18 enquiry forms, at ₹624 per enquiry form (25 Mar–16 May 2026)
WhatsApp clicks - Performance marketing
Duraca Plast
62 buyer actions in 10 weeks of ads
62 buyer actions in 10 weeks of ads: 49 WhatsApp clicks and 13 enquiry forms at about ₹952 each; around position 7 for 'ice box manufacturer'
WhatsApp clicks - Performance marketing · SEO · Local SEO
E-Shine
31 enquiry forms
31 enquiry forms (May 2025–Oct 2026, about 1 estimated for Aug 2026), 22 of them from Google Ads at about ₹1,449 each; average Google position 19.9 → 10.0 and 23,654 impressions
Enquiry forms, all sources
Ready tobe seen?
Tell us what you sell and where. We check your Google listing, website, ads and AI answers for free, and tell you what to fix first, within [two working days].
Get visible[email protected] · +91 63544 29800 · WhatsApp