1,557 phone taps and calls credited to Google Ads and 1,709 clicks on the online appointment link.
From February to October 2026, Zero Dimensions ran Google Ads for Aditya Hospital in Rewari, and Google credited the ads with 1,557 phone taps and calls, 1,551 of them in April–October at about ₹80 each (Google Ads, as reported by Google).
- Client
- Aditya Hospital, Rewari
- Industry
- Healthcare and pharma
- Services
- Performance marketing
- Result
- 1,557 phone taps and calls credited to Google Ads and 1,709 clicks on the online appointment link (Feb–Oct 2026)
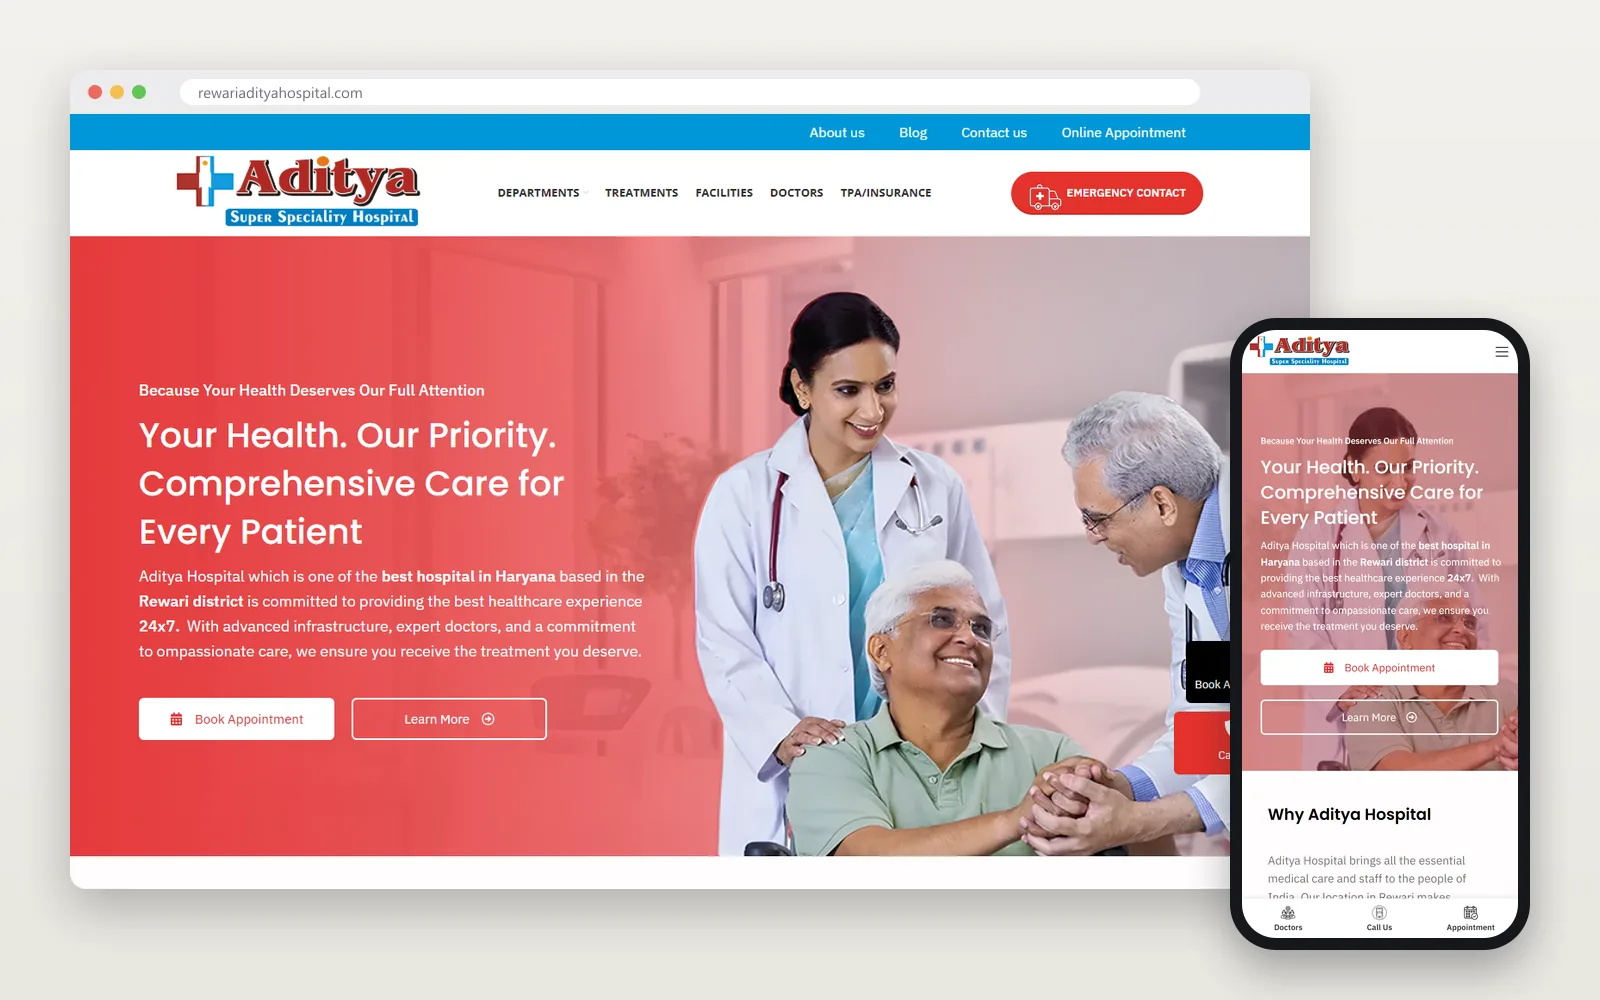
From February to October 2026, Zero Dimensions ran Google Ads for Aditya Hospital in Rewari, and Google credited the ads with 1,557 phone taps and calls, 1,551 of them in April–October at about ₹80 each (Google Ads, as reported by Google).
The challenge
Aditya Hospital is a 64-bed multi-speciality hospital in Rewari, Haryana, with a 24×7 emergency service. Its departments include neurosurgery and spine, orthopaedics, cardiology, general and laparoscopic surgery, urology and radiology, including MRI.
It needed phone calls and appointment requests for spine care, neurosurgery, orthopaedics and MRI scans. Its new website, which we built, went live on 12 January 2026 with phone numbers and an online appointment link on each service page. The hospital keeps no call log, so every call from the ads had to be counted through Google's own tracking.
What we did
Built a search campaign for the main services
We set up a Google Search campaign on 10 February 2026, and the first ads ran on 11 February. It started with MRI, neurosurgery and orthopaedic ads, added spine and brain-surgery ads in April and a second neurosurgery ad group in late May, each pointing to the matching page on the new website.
Linked the ads to the Business Profile and tracked calls
We linked the campaign to the hospital's Google Business Profile, so from 30 March 2026 Google counted profile calls and direction requests that follow an ad. From 6 April we tracked taps on the website's phone numbers after an ad click and used them as the bidding goal until 1 July. On 24 October we added calls from the ad's call button as the new goal.
Added a display campaign around Rewari
On 30 September 2026 we started a display campaign for the hospital's diagnostic services and government health panels, shown to people in Rewari and the surrounding districts. It brought 1,801 clicks for ₹3,181 by 31 October 2026 (Google Ads).
Moved the budget to Google Search
From 16 September 2026 we cut spend on Google's search partner sites from up to ₹1,552 a day to under ₹140 a day, and from 27 October ran the search campaign on Google Search only, with the call button showing. Google Search's share of the search campaign's spend rose from 21.0% in April–September to 89.0% in October 2026 (Google Ads).
Reported on calls
We reported to the hospital on calls from the ads in our July and September 2026 reports.
Results
From February to October 2026 the ads brought 14,226 clicks for ₹1,46,548. Google credited them with 1,557 phone taps and calls: 1,304 taps on the website's phone numbers, 241 calls from the hospital's Business Profile that Google links to an ad, and 12 calls from the ad's call button. In April–October, with all three being counted, that was 1,551 for ₹1,24,355, about ₹80 each (Google Ads, as reported by Google).
Over the same nine months the hospital's Google Business Profile took 4,775 calls, 17.5 a day, against 1,493 calls, 12.1 a day, in October 2025 – January 2026. It also took 10,923 direction requests (Google Business Profile, all sources).
On the website, Google Analytics recorded 7,356 visits from the ads, and those visitors clicked the online appointment link 1,709 times. In January 2026, before the ads, there were no visits from paid search (Google Analytics).
| Month | Spend | Of which on search partner sites | Clicks | Taps on the website's phone numbers after an ad | Profile calls Google links to an ad | Calls from the ad's call button | Spend per tap or call |
|---|---|---|---|---|---|---|---|
| February 2026 | ₹9,244 | ₹0 | 338 | not tracked | not tracked | 5 | – |
| March 2026 | ₹12,949 | ₹0 | 407 | not tracked | 1 (from 30 March) | 0 | – |
| April 2026 | ₹25,353 | ₹14,064 | 1,801 | 146 | 33 | 0 | ₹142 |
| May 2026 | ₹26,666 | ₹25,131 | 2,775 | 238 | 31 | 0 | ₹99 |
| June 2026 | ₹21,958 | ₹21,831 | 2,865 | 410 | 6 | 0 | ₹53 |
| July 2026 | ₹21,415 | ₹15,704 | 2,145 | 264 | 23 | 0 | ₹75 |
| August 2026 | ₹2,485 | ₹1,308 | 253 | 18 | 15 | 0 | ₹75 |
| September 2026 | ₹15,201 | ₹11,162 | 1,410 | 166 | 92 | 0 | ₹59 |
| October 2026 | ₹11,277 | ₹904 | 2,232 | 62 | 40 | 7 | ₹103 |
| February–October 2026 | ₹1,46,548 | ₹90,104 | 14,226 | 1,304 | 241 | 12 | – |
| April–October 2026 | ₹1,24,355 | ₹90,104 | 13,481 | 1,304 | 240 | 7 | ₹80 |
Source: Google Ads, as reported by Google, checked on 9 November 2026. Website taps were tracked from 6 April 2026 and profile calls linked to an ad from 30 March; the call button showed on 11–18 February and from 27 October. Spend per tap or call is the month's spend divided by all three. October includes ₹3,038 and 1,724 clicks from the display campaign.
The numbers behind this chart
| Month | All spend | Spend on search partner sites |
|---|---|---|
| Feb 2026 | ₹9,244 | ₹0 |
| Mar 2026 | ₹12,949 | ₹0 |
| Apr 2026 | ₹25,353 | ₹14,064 |
| May 2026 | ₹26,666 | ₹25,131 |
| Jun 2026 | ₹21,958 | ₹21,831 |
| Jul 2026 | ₹21,415 | ₹15,704 |
| Aug 2026 | ₹2,485 | ₹1,308 |
| Sep 2026 | ₹15,201 | ₹11,162 |
| Oct 2026 | ₹11,277 | ₹904 |
The numbers behind this chart
| Month | Website phone taps | Profile calls linked to an ad | Calls from the ad's call button |
|---|---|---|---|
| Apr 2026 | 146 | 33 | 0 |
| May 2026 | 238 | 31 | 0 |
| Jun 2026 | 410 | 6 | 0 |
| Jul 2026 | 264 | 23 | 0 |
| Aug 2026 | 18 | 15 | 0 |
| Sep 2026 | 166 | 92 | 0 |
| Oct 2026 | 62 | 40 | 7 |
| Month | Google Ads spend | Profile calls | Calls Google Ads links to an ad | Direction requests | Direction requests Google Ads links to an ad |
|---|---|---|---|---|---|
| October 2025 | ₹0 | 405 | – | 752 | – |
| November 2025 | ₹0 | 308 | – | 599 | – |
| December 2025 | ₹0 | 382 | – | 635 | – |
| January 2026 | ₹0 | 398 | – | 747 | – |
| February 2026 | ₹9,244 | 473 | not tracked | 918 | not tracked |
| March 2026 | ₹12,949 | 536 | 1 | 1,083 | 7 |
| April 2026 | ₹25,353 | 481 | 33 | 1,224 | 130 |
| May 2026 | ₹26,666 | 529 | 31 | 1,355 | 91 |
| June 2026 | ₹21,958 | 542 | 6 | 1,239 | 14 |
| July 2026 | ₹21,415 | 556 | 23 | 1,245 | 27 |
| August 2026 | ₹2,485 | 555 | 15 | 1,352 | 43 |
| September 2026 | ₹15,201 | 574 | 92 | 1,280 | 128 |
| October 2026 | ₹11,277 | 529 | 40 | 1,227 | 78 |
| October 2025 – January 2026 | ₹0 | 1,493 | – | 2,733 | – |
| February–October 2026 | ₹1,46,548 | 4,775 | 241 | 10,923 | 518 |
Sources: Google Business Profile (calls are taps on the profile's call button) and Google Ads, as reported by Google, both checked on 9 November 2026.
The numbers behind this chart
| Month | Profile calls |
|---|---|
| Oct 2025 | 405 |
| Nov 2025 | 308 |
| Dec 2025 | 382 |
| Jan 2026 | 398 |
| Feb 2026 | 473 |
| Mar 2026 | 536 |
| Apr 2026 | 481 |
| May 2026 | 529 |
| Jun 2026 | 542 |
| Jul 2026 | 556 |
| Aug 2026 | 555 |
| Sep 2026 | 574 |
| Oct 2026 | 529 |
| Month | Visits from paid search | Outbound link clicks from those visits (1,709 of the 1,718 on the online appointment link) |
|---|---|---|
| January 2026 | 0 | 0 |
| February 2026 | 133 | 6 |
| March 2026 | 131 | 2 |
| April 2026 | 806 | 53 |
| May 2026 | 1,443 | 352 |
| June 2026 | 1,838 | 621 |
| July 2026 | 1,192 | 449 |
| August 2026 | 90 | 7 |
| September 2026 | 709 | 94 |
| October 2026 | 1,014 | 134 |
| February–October 2026 | 7,356 | 1,718 |
Source: Google Analytics, Paid Search channel, checked on 9 November 2026.
| Month | Spend with a known location | People placed in Delhi or New Delhi | People placed in Rewari and nearby towns |
|---|---|---|---|
| February 2026 | ₹7,857 | 37.6% | 2.6% |
| March 2026 | ₹10,802 | 64.7% | 1.2% |
| April 2026 | ₹20,866 | 62.1% | 1.3% |
| May 2026 | ₹22,753 | 70.5% | 0.4% |
| June 2026 | ₹19,372 | 61.0% | 0.2% |
| July 2026 | ₹17,138 | 63.7% | 0.3% |
| August 2026 | ₹2,081 | 70.8% | 2.5% |
| September 2026 | ₹12,435 | 61.2% | 4.1% |
| October 2026 | ₹6,782 | 35.6% | 12.1% |
| February–October 2026 | ₹1,20,087 | 60.9% | 1.8% |
Source: Google Ads location report, all campaigns, checked on 9 November 2026. Google gave a location for ₹1,20,087 of the ₹1,46,548 spent. Rewari and nearby towns: Rewari, Dharuhera, Bawal, Narnaul, Bhiwadi, Neemrana, Jhajjar and nearby villages.
| City (where Google placed the person) | Ad spend | Clicks | Share of located spend |
|---|---|---|---|
| Delhi | ₹49,440 | 3,942 | 41.2% |
| New Delhi | ₹23,722 | 1,700 | 19.8% |
| Sonipat | ₹14,311 | 1,643 | 11.9% |
| Gurugram | ₹4,449 | 126 | 3.7% |
| Noida | ₹4,036 | 255 | 3.4% |
| Meerut | ₹3,531 | 301 | 2.9% |
| Faridabad | ₹1,769 | 116 | 1.5% |
| Ghaziabad | ₹1,604 | 127 | 1.3% |
| Agra | ₹1,338 | 110 | 1.1% |
| Bhiwadi | ₹1,225 | 114 | 1.0% |
| Rewari and nearby towns (9 towns, Bhiwadi included) | ₹2,176 | 393 | 1.8% |
| All spend with a known location | ₹1,20,086 | 10,547 | 100% |
What else changed, and what didn't work
- Profile calls are not credited to the ads. Their rise began before the first ad, alongside the new website (live 12 January 2026) and our SEO work. From April to October the profile took 17.7 calls a day on days with almost no ad spend and 17.6 on days with spend, so a day-by-day comparison could not show an effect from the ads (Google Business Profile, Google Ads).
- Most website taps came from search partner sites. 1,248 of the 1,304 came from Google's partner sites, which took ₹90,104 of the spend; Google filtered about one in five of their clicks as invalid. Taps are not answered calls, and the hospital keeps no call log (Google Ads, as reported by Google).
- Most clicks came from outside the Rewari area. 60.9% of the spend with a known location reached people placed in Delhi or New Delhi and 1.8% people in Rewari and nearby towns, rising to 12.1% in October. 1,046 of the 1,718 link clicks from ad visitors came from people placed in Delhi or New Delhi (Google Ads location report, Google Analytics).
- Gaps in the ads. The call button showed only on 11–18 February and from 27 October 2026, and the ads stopped on 13–31 August and for shorter spells in March, May, June and July (Google Ads).
Figures checked on 9 November 2026. Google keeps adding late conversions for several weeks and can revise Business Profile figures for recent days, so October 2026 may change slightly.
More work
- SEO · Local SEO
Aditya Hospital, Rewari
Direction requests up 57%
Direction requests up 57%: 4,029 → 6,343 (Jun–Oct 2025 vs 2026); Maps profile views 6,256 → 13,592
Direction requests - Local SEO
GastroPlus
6,169 calls
6,169 calls (+33%) and 9,405 direction requests (+17%) from four Business Profiles (Jun–Oct 2026 vs 2025)
Calls from the four profiles - Local SEO · SEO · Performance marketing
Heyansh Oral Cancer Hospital
Direction requests 577 → 1,614 and listing calls 57 → 209
Direction requests 577 → 1,614 and listing calls 57 → 209 (Jun–Oct 2025 vs 2026); Google clicks 199 → 543 (Jul–Sep)
Main listing (Maninagar)
Ready tobe seen?
Tell us what you sell and where. We check your Google listing, website, ads and AI answers for free, and tell you what to fix first, within [two working days].
Get visible[email protected] · +91 63544 29800 · WhatsApp